Tuesday, December 28, 2010

A Mainstream Economist Recognizes the Finite World

On the day after Christmas, the NY Times published a Paul Krugman column titled "The Finite World."  From that column (all emphasis mine):
Oil is back above $90 a barrel. Copper and cotton have hit record highs. Wheat and corn prices are way up. Over all, world commodity prices have risen by a quarter in the past six months....
What the commodity markets are telling us is that we’re living in a finite world, in which the rapid growth of emerging economies is placing pressure on limited supplies of raw materials, pushing up their prices. And America is, for the most part, just a bystander in this story.... 
So what are the implications of the recent rise in commodity prices? It is, as I said, a sign that we’re living in a finite world, one in which resource constraints are becoming increasingly binding. This won’t bring an end to economic growth, let alone a descent into Mad Max-style collapse. It will require that we gradually change the way we live, adapting our economy and our lifestyles to the reality of more expensive resources.
 Is Dr. Krugman's prediction that there won't be a collapse, that we'll just gradually adapt our lifestyle, a reasonable one?  Almost 40 years ago, The Limits to Growth made predictions about possible outcomes based on a finite set of resources.  The following chart illustrates the standard run of the world model used in Limits (from The Limits to Growth: The 30-Year Update, used without permission).  The standard run shown in Limits has stood up remarkably well over the nearly 40 years that have passed since it was originally published [1].  The standard run prediction is that there will be a collapse in industrial output, that it should begin in another few years, and that by 2035 or so the global per-capita output will have fallen by more than half.


These two very different views are not necessarily inconsistent.  The Limits view is global, while Dr. Krugman's is specific to the US.  The effects of a collapse are unlikely to be distributed equally around the world.  For example, the US is a very large exporter of food (measured in calories), while almost all countries in Africa are net calorie importers.  Decreased US food production may result in changes in diet, but is unlikely to cause famine in the US (the Krugman prediction).  The corresponding decrease in US exports could, though, leave Africa unable to acquire enough calories to feed its population with widespread famine as the result (the Limits prediction).  This situation would be particularly true if an export-land model effect holds for food as well as other natural resources.  Such an effect would result in US net exports of calories declining at a rate much faster than the decline in production.

Dr. Krugman's prediction also conflicts with the global predictions given in works such as Michael Klare's Resource Wars [2].  In Klare's view, the world will see actual "hot" wars fought over access to resources: oil, water, minerals, etc.  US involvement in such wars seems to me to be unlikely for multiple reasons.  The US still has a robust allocation of natural resources, particularly if we were inclined to manage them better.  The US is relatively isolated from much of the rest of the world: other than Canada, Mexico, and parts of the Caribbean, US involvement has to be across oceans.  And finally, I expect the US people to recognize that the large amounts of resources that are needed to support such long-distance conflict might impact civilian availability to a greater degree than making the effort towards self-sufficiency.  Again, Krugman and Klare's predictions are not necessarily inconsistent on a regional rather than global basis.

I expect all of the predictions mentioned above to be "right" to some degree.  I expect hot wars over natural resources.  And I expect a fairly rapid decline in global food and industrial production.  But I expect the US to stay out of foreign entanglements, and that the decline in production of critical goods and services in the US to be modest, successfully handled by Krugman's "adapting... our lifestyles" approach.  At least for sections of the US; it seems entirely possible to me that areas of the US that have high populations and smaller allocations of natural resources will have problems.  But more on that another day.


[1]  Graham Turner, A Comparison of the Limits to Growth With Thirty Years of Reality, CSIRO, June 2008.

[2]  Michael T. Klare, Resource Wars: The New Landscape of Global Conflict, 2001.

Friday, December 17, 2010

State budget crises consequences

From time to time I leave comments at The Oil Drum based on my experience as a member of the Colorado legislature's budget staff. Recently, Jeffrey Brown (westexas at TOD) asked me to write a piece about the likely outcomes of the current state budget crises. For various reasons, it ended up being posted as a guest piece at Gail Tverberg's Our Finite World blog, and reposted at the Energy Bulletin (Post Carbon Institute). Just to be complete, I'm reposting it here.

Monday, November 29, 2010

Fixing the BCS

This past week, Gordon Gee of Ohio State said publicly that Boise State and Texas Christian have no business playing in the BCS title game.  Gee's complaint is that neither Boise nor TCU play the kind of "murder's row" schedule that the Big 10 and SEC member schools play.  This would seem to be a rather peculiar argument to make at this point in the season, when Ohio State's strength of schedule (SOS) is, according to the Sagarin rankings, somewhere between Boise's and TCU's.  It seems even more peculiar in a year when the Big East, one of the conferences whose champion gets an automatic BCS bid, has only one team in the top 25, West Virginia currently at #24.

The BCS system was set up by the big conferences (and Notre Dame) in order to ensure that they got teams into the big-money bowls.  And it worked well for a considerable time, since teams outside of the anointed groups seldom made it into the upper reaches of the rankings on a consistent basis.  The system could handle the infrequent interloper, buying them off with a big payday as an at-large team.  The possibility that an outside team would achieve sustained success seemed remote.  The "strength of schedule" argument is the last line of defense in that case.  The outside teams only seem to be doing consistently well, the argument says, since they don't have to play a difficult conference schedule during the stretch run of the season.

Oddly enough, the situation has become a matter of proposed public policy.  Each year of late there are numerous outcries for Congress to force the NCAA and the BCS schools to do something different.  The most common suggestion is a playoff system similar to that used by the other NCAA divisions.  Such proposals would appear to ignore the important role that the bowl system, with the big games scheduled in a short period of time between semesters or quarters, play in the overall big-time college football picture.  The bowls provide the conferences with additional money (and revenue sharing means that even the poorer schools in the big conferences get a cut).  The bowls are a major recruiting opportunity.  The long lead time for the major bowls give fans time to plan a vacation trip around their team's game.

The problem is, in my mind, not so much that the BCS arrangement with the conferences is a largely closed arrangement, it is that the conferences themselves are closed.  This past summer demonstrated that changing conference membership is quite possible: Nebraska went to the Big 10, Colorado and Utah went to the Pac 10, Boise State went to Mountain West.  The last two make an interesting contrast.  Utah will no longer have to listen to complaints that they didn't play in one of the "tough" conferences.  Boise still will, even though it's pretty easy to make the case that the Mountain West will be superior to the Big East as far as the caliber of its football.

The obvious answer is to make the conferences "open" in the same way that the English Premier soccer league is.  Each year, drop the team with the worst record from the conference (at least for football purposes).  Replace the dropped teams with the highest ranked teams from outside the BCS conferences.  With such an arrangement in place, Gordon Gee's argument would be moot: Boise and TCU would have been added to the big conferences in place of teams like Indiana and Vanderbilt some years ago.  Complaints that such changes would break up tradition are silly.  Teams play four non-conference games each year, and the traditional rivalries could easily be scheduled in those slots.

The post-season part of the BCS system isn't broken.  It serves both the schools and the fans well.  The real problem is that the conference system is broken.  Open the conferences up and let the rising new teams have an opportunity to compete on the "equal" playing field.

Sunday, November 21, 2010

Measuring the Volt's mileage

As reported by CNN, the Chevy Volt faces one last government hurdle before it goes on sale to the public.  New cars must have an EPA mileage sticker in order to be sold in the US.  The EPA hasn't figured out how to measure the mileage of a plug-in electric hybrid.  No measurement standard, no sticker, no sales.  This isn't a new issue; GM has been in discussions with the EPA since before September 2008, and the issue remains unresolved.  If you haven't looked recently, the current EPA window sticker for a gas-powered vehicle looks like this:


The case of an all-electric car has also been settled.  The relevant portion of the Tesla Roadster is shown below.  A picture of a stylized battery instead of a stylized gas pump, and the kiloWatt-hours for 100 miles in city and highway conditions instead of the MPG figures.  Of course, there's always the caveat that "actual consumption and range may vary."  Nissan has agreed that the range on a full charge for its new Leaf will vary wildly depending on the conditions: from as high as 138 miles, cruising at 38 MPH and an outside temperature of 68 degrees, to as low as 47 miles in stop-and-go traffic averaging 6 MPH, an outside temperature of 86 degrees, and the air conditioning running.


A plug-in hybrid can be rated in several different ways.  You can measure the gasoline mileage when the vehicle is running on gas, as would be the case for most of an extended highway trip.  The Volt will probably be somewhere in the upper 30s as a straight gasoline vehicle.  You can measure the efficiency as an electric vehicle, in kWh per 100 miles.  The Volt will probably be in the same 30-33 range that the Tesla Roadster and the BMW Mini E get, given similar weights, battery packs, and electric motor efficiency.  But what about the cases where you use both modes?

Assume that the Volt delivers on the 40-mile range from a fully charged battery, and gets 37 MPG on gasoline once the battery is depleted.  A 30-mile trip starting with a fully-charge battery gets infinite gasoline mileage because no gasoline is used.  A 30-mile trip starting with a half-charged battery gets 74 MPG (15 miles on gasoline uses 0.405 gallons, divided into 30 miles).  A 120-mile trip (round trip to my repair something at my daughter's house, say) starting with a fully charged battery get 55 MPG).  One proposed EPA methodology, since discarded, would have given the Volt a rating of 235 MPG for city use.  Working backwards, and using the assumptions above, yields about 47.5 miles driving between charges.

I hold out little hope that the EPA will be able to boil things down to a single tidy window sticker that is useful to consumers.  They can provide the basic information: likely battery-pack range, kWh per 100 miles, and gasoline mileage.  But it's going to be up to the individual consumer to know their driving habits in order to determine how much of the time they can operate in electric mode and how much in gasoline.  If Chevy sales staff are going to be helpful, they're going to need some training so that they can sit down with potential customers and help them work through the details.

To use myself as an example:  I currently drive about 7,000 miles per year.  1,000 of that is a single round-trip to my mother's each summer, another 1,000 is probably on days with between 40 and 120 miles driven, and 5,000 is on days less than 40.  On the other hand, Colorado has recently adopted new electric tariffs so that the incremental electricity used to charge a plug-in vehicle would likely be billed at a higher rate in the summer but not in the winter.  Do I drive more in the summer or winter?  To be honest, excluding the trip to my mother's (which would be almost all gasoline anyway), I have no idea.  And I'd be willing to bet most other people don't either.

In the long run, electric cars make sense because that's how you can burn coal, nuclear, hydro, wind, or solar power in your personal transportation system.

Thursday, November 11, 2010

IEA 2010 World Energy Outlook

The International Energy Agency (IEA) released their 2010 World Energy Outlook this week.  The freely available key graphs file contains two that seem particularly interesting from a macro view.  The first shows their forecast for global oil production:


There are a number of things worth noting from this forecast.  First, they show that currently producing crude oil fields, taken together, are in terminal decline.  There's an implication there that enhanced recovery techniques are not going to save us.  Second, total crude production stays almost perfectly level for the next 25 years; by 2035, production from fields we already know about, but are not currently producing, will still be increasing; and fields yet to be found will be producing over 30% of the total conventional crude.  I'll say something about how unlikely I find that in a few days.  The fact that new production almost exactly offsets the decline in current fields seems suspicious.  Finally, total liquids production increases to over 95 million bbl/day, with the increase all coming from natural gas liquids and unconventional sources.

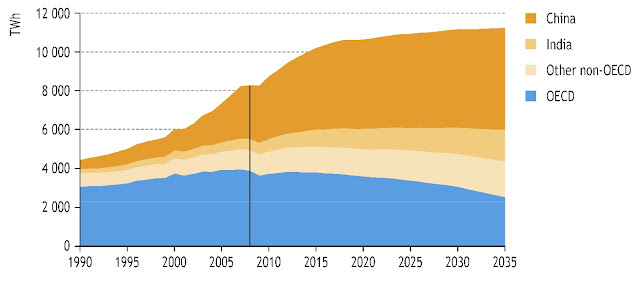
The second graph is the one for the forecast of coal use for generating electricity:

China is forecast to increase their electricity production from coal by almost 50%, driving a global increase of 25% over 2010 levels.  You have to think about where the increased production is going to come from.  Generation will probably become more efficient, assuming that new plants use supercritical and ultracritical steam cycles, but a substantial increase in coal production will still be necessary.  It seems to me that such an increase is at least problematic.

If you are a believer in climate change caused by increasing levels of CO2 in the atmosphere, these two graphs together are extremely discouraging.  Unless you believe that China is going to capture and store the emissions from its coal-fired power plants, the graphs tell a story of steadily increasing emission levels, not the rapidly declining levels that would be necessary to stabilize the CO2 levels already present.

Monday, September 27, 2010

Interpreting Declining Productivity Trends

A week or so ago, Stuart Staniford wrote a piece regarding declining productivity gains in the US economy.  I draw different conclusions.  Stuart's chart of the data is shown here, and he concludes that there is a long-term trend of decreasing productivity gains, which will have serious consequences in the not-too-distant future.


Before fitting a simple linear regression to this data, there may be adjustments that have to be made. In this case, the quarterly data is strongly autocorrelated; the growth rate in one quarter tends to reflect the growth rate of the previous quarter.  This type of data problem has been recognized for a long time: it was part of the time series course I took in graduate school in the 1970s.

With an adjustment for autocorrelation made, the decline in productivity growth looks much less drastic.  My version of the chart is shown here.  While the trend line ends up in about the same place, it starts from a much lower level in 1950 (my chart starts from the beginning of the data in 1947; Stuart discarded the first couple of years of data for innocuous reasons; including the earlier data does make a difference).  While the negative trend is not as steep as Stuart's graph suggests, it is still statistically significant.


But that's not the end of the story.  Suppose that you asked the same question -- is there a statistically significant long-term negative trend -- at different points in time.  In particular, suppose you asked that as each quarter's data was added over the last 30 years.  The next plot shows an answer to that.  Each bar represents the calculated linear trend, with adjustment for autocorrelation, using all data from 1947 to that point, but only if the t-value for the coefficient is significant at a reasonable level.  What this appears to show is that during and following most recessions1, the long-term trend looks like it has a negative non-zero coefficient; except for those periods, the linear trend coefficient is not significantly different from zero2.  In effect, what we see is a variation on Friedman's "plucking" model for business cycles and long-term growth, originally published in 1964.


While I may disagree with Stuart's statistics, I don't disagree with his concern about declining productivity growth.  There are a number of reasons to believe that productivity growth will slow in the future, and that such a slowing will have consequences (eg, see here).  It's a critically important topic, particularly in an era with declining energy availability.  But I don't believe that the data show that it's happening just yet.

1 The recession of 1991-2 was, according to most measures, a very modest one. The trend coefficient estimate was negative during that period, but was not significant.

2 There are a few quarters where the estimate for the coefficient is positive rather than negative. However, none of those estimates are statistically significant at the level used.

Friday, September 17, 2010

Colorado's Fiscal Future

A non-energy topic today.

I live in Colorado, a state where it is easy for citizens to place issues on the ballot.  It is equally easy to put proposed statutes and proposed amendments to the state constitution on the ballot, so we see a lot of proposed amendments.  After all, why bother with a mere statute, which might be revised by the General Assembly at some point, when you can put what you want into the constitution where it is beyond the legislature’s reach?  I want to talk about three of the proposals that have been approved for inclusion on the 2010 ballot: amendment 60, amendment 61, and proposition 101.  The text of the proposals is available here.  The changes would be phased in over a period of years.

Taken together, these three would substantially reduce tax rates and fees at both the state and local level, and drastically restrict all levels of government’s ability to borrow.  Further, the state would be required to backfill, from its General Fund, the decreased revenues that K-12 school districts would see as a result of property tax rate reductions.

Every voter receives a copy of the “blue book,” an explanation of the effects of each ballot issue.  The blue book is prepared by legislative staff, and the final language is approved by the Legislative Council Committee, a group of 18 of the legislature’s majority and minority leadership.  The analysis is required to include arguments both for and against the proposal, and staff’s estimate of its fiscal impact.  The staff’s cumulative analysis if all three proposals pass suggests that 99% of the state General Fund would be transferred to local K-12 school districts, leaving about $38 million for other programs such as prisons, higher education, and human services.

A majority of the Republican members of the legislature have signed a letter against passage of these proposals.  County Commissioners all over the state have come out in opposition.  So have a variety of Chambers of Commerce.  Opponents of the proposals have raised $4.1 million in funding so far.  But a recent poll indicated that the for/against numbers are currently 51/33 for proposition 101, 36/34 for amendment 61, and 32/45 for amendment 60.  It is worth asking whether these measures have any real chance of passing.

In 2005, the Colorado ballot included Referendum C, a measure which allowed the state government to retain revenue that would have otherwise been returned to taxpayers.  As a referred measure, two-thirds of each chamber of the Republican-controlled General Assembly approved the measure.  Then-Governor Bill Owens campaigned actively for the measure.  Business organizations all over the state supported the measure.  Proponents spent almost $8 million dollars.  The final tally, though, was 52.1% for and 47.9% against.  Referendum D, a separate measure that would have allowed the state to borrow money for a variety of projects, was narrowly defeated.

Colorado has a peculiar electorate.  We probably have as large a share of voters who are simply opposed to government on general principles as any state.  We have an inordinate number of newcomers -- the Front Range area population has increased by over a million in the last 20 years, and is forecast to add another million in 15 -- who have not put down real roots.  As a result, we don’t give much to charity -- a 2007 study found that the state ranked 5th nationally in personal income, but ranked 36th in charitable giving.  Many of the newcomers are young and/or single, with little interest yet in the quality of the local schools.  A disproportionate number of our college-educated got that education before they moved to Colorado, and so have little attachment to the local institutes of higher education.

I always figure that an anti-tax proposal will always draw at least 40% approval.  In tough economic times, when many are worried about their houses (for the last couple of years, Colorado has pretty consistently been in the top 10 for percent of houses with negative equity, and for foreclosures), the percentage is probably a couple of points higher.  Proponents need only convince another 8% or so of the voters in order to get the measures passed.  I predict that all three will draw at least 45% in November, and that at least one will pass.

What are the probable consequences if one or more pass?  Colorado will, over the next several years, become a much less pleasant place to live if you are poor, disabled, looking for higher education opportunities, or any combination of those.

Wednesday, August 18, 2010

What Does an Energy Survey Tell Us?

Green Car Congress points to a recent study in which survey participants indicated their perceptions about the relative efficacy of various energy-saving actions.  The abstract for the paper makes a large deal out of the observation that when asked which strategies they could implement to save energy, many more people chose curtailment than efficiency.  In other parts of the survey, participants demonstrated a general lack of knowledge about efficiency differences in various activities; for example, that moving freight by rail uses much less energy than moving the same freight by long-haul truck.

Perhaps because I've gotten old and cynical, I am often suspicious of surveys.  It is simply too easy to slant the survey questions, intentionally or not, and affect the outcome.  In this particular case, the paper includes an appendix with the survey questions.  Some of the questions are clearly tests of basic numeracy: if you replace a 100 watt light bulb with a 75 watt bulb for one hour, how many energy units are saved?  (Energy units are watt-hours, although that term is never used.)  Other questions are tests of broad knowledge about energy consumption.  How many energy units would be saved by drying a load of laundry on a clothesline instead of in a dryer?  Rank-order the efficiency of planes, trains, trucks, and ships for freight transport.

The concern — people choosing curtailment over efficiency — would appear to be the result of the very first question in the survey: "In your opinion, what is the most effective thing that you could do to conserve energy in your life?"  I have two complaints about drawing conclusions from this question.  The first is that it is the first question in the survey.  IMO, this should have been the last of the energy-related questions.  Placed first, and phrased the way it is, I think people would be inclined to think in terms of what changes they could make in their day-to-day activities that would save energy.  If that is the case, it is not surprising that answers like "turn off the lights", "turn down the thermostat", and "drive fewer miles" would be most common.

In practice, the things that are most effective are matters of efficiency and all require up-front investments.  Improving mileage from 20 MPG to 30 MPG requires purchasing a new vehicle.  Improving appliance efficiency means buying new appliances.  Once you have done the simplest weatherizing activities, improvements require major efforts such as replacing windows or insulating walls.  For renters, many of these are simply not options.  For the poor, investments are always difficult: the fact that a new $750 refrigerator will save more than that in energy costs over five years is immaterial if you don't have $750 in cash or credit available to you.

The same investment problem arises when you look at things like freight transportation.  Rail is much more efficient that long-haul trucking.  But the trucking industry provides scheduled service: load the trailer in Denver today, and the trucking company promises to deliver it to St. Louis the day after tomorrow.  Railroads no longer operate scheduled freight trains.  Load the boxcar in Denver today, and the rail carrier will deliver it to St. Louis when they can assemble a full train going that way.  Maybe tomorrow, maybe next week.  Either the railroads must invest in the equipment to allow them scheduled service, or businesses must invest in inventory.  Given the rise of just-in-time supply chains, and the decision by the railroads to give up scheduled freight service, businessmen simply don't think in terms of "I could switch from truck to rail for shipping."

I think the important result of the survey is not the matter of ignorance raised by the authors, but rather that the results demonstrate the participants' aversion to investment.  Politicians, whatever their other faults, are generally shrewd judges of their constituencies.  Much of the insanity in current US energy policy debate is because the politicians understand voters' aversion to having to make personal investments in efficiency.  One of the things that makes ethanol attractive, politically, is that it holds out the hope that people won't have to buy new cars.

The two biggest challenges in getting sane energy policy implemented are (1) convincing people that large personal investments are necessary and (2) settling on which investments are the ones that need to be made.  Most of the debate today involves (2); but (1) is likely to be more difficult to accomplish.

Monday, August 16, 2010

Who Will Tend the Wind Turbines?

For the purposes of a book I'm trying to write, I had two maps of the United States laid out side by side the other day. These two maps are reproduced below, one above the other. The first is onshore wind power potential at 80 meters, from the National Renewable Energy Laboratories in Golden. The second is the percent change in population from 2000 to 2009 on a county-by-county basis, from Census Bureau data. In the first, the lavender and purple areas of the Great Plains are the best wind resources. In the second, the purple areas are counties that lost population. The correlation is not exact, but is certainly there.


Clearly, if the US is to use onshore wind power in a large way, the wind farms are going to built on the Great Plains. Consider the broad characteristics of such a system. The US consumes about 3.9 billion MWh of electric energy each year. Assume that we could eliminate half of that through efficiency and demand management, and that we want to generate half of the remainder from wind. More assumptions: 3.0 MW wind turbines, generating the equivalent of full-power one-third of the time, so 8760 MWh per turbine per year. Do the simple calculations and you get an estimate of about 110,000 turbines.

That figure is too low if reliability is considered. What is really needed is a figure for the number of turbines that need to be installed if we want to produce a certain level of power for a large percentage of the time. For example, based on the above numbers, we might specify that we want to produce at least 110,000 MWh of electricity during 95% of all daytime hours in the year. That's a much more complicated number to estimate depending as it does on a number of probabilistic variables. For our purposes, though, assume that another 50% is sufficient. That raises the required number of turbines to 165,000. (I suspect that number is still too low, and am looking for any work that has been done on stochastic models that would yield an answer that is not just a guess.)

One of the big knocks on wind power has always been that it's intermittent. Given enough turbines (and 165,000 is our guess at "enough"), much of that problem can be addressed by geographic diversity. Scatter the turbines from the Canadian border to the center of Texas, spread them out over hundreds of miles from west to east, and it becomes feasible to produce power at a fairly steady rate. Connect the turbines to a large north-south AC grid. Connect high-voltage DC transmission lines to that grid sending power most of the way to both the East and West coasts. All of that is technically feasible. There may be financing problems, or problems acquiring the volume of rare-earth magnets needed for that many 3.0 MW generators, and so forth. But the concept is straightforward and all of the engineering is feasible.

There is, OTOH, a heck of an operation and maintenance problem to deal with. For example, if turbines have a 30-year expected lifetime, roughly 5500 of them will need to be replaced each year. All the turbines, the entire AC grid interconnecting them, and the source end of the HVDC links are scattered broadly across the Great Plains, an area that is rapidly depopulating. How do we attract the technicians, engineers, project managers, and all the other skilled labor to work and live in that area? An engineer with a spouse and children is going to ask difficult questions. What are the quality of the schools? Who will straighten my children's teeth? Where will my spouse work? How good are the hospitals? How far is it to the nearest cardiac specialist, or neurosurgeon, or orthopedist? In the interior portions of the Plains, the answers to those questions are generally dismal, and getting worse.

Construction of this very large new infrastructure is likely to bring other problems to the rural areas. The West has seen the same pattern play out repeatedly when a new energy resource is developed: the sudden influx of "outsiders" is followed shortly by large increases in drug availability, prostitution, and various violent crimes that the local authorities are ill-prepared to handle. Local infrastructure such as roads is battered to the point it breaks down. There is no reason to believe that building hundreds of wind farms across the Great Plains will be any different. Again, these are not conditions that make it easy to attract skilled labor.

To sum things up, it may be technically feasible to build the wind-power infrastructure necessary to provide a large portion of US electricity. The social difficulties of building and then operating that infrastructure look to be much more difficult. Who are the people who will tend the turbines?

Monday, July 19, 2010

Who Captures Declining Net Oil Exports?

Roughly 60% of the petroleum consumed in the United States is imported from other countries. In order for one country to import petroleum or petroleum products, one or more other countries must export a corresponding amount. If available exports were somehow constrained, which countries would be able to “capture” them? Because supply constraints generally imply higher prices, the conventional wisdom has been that richer countries – developed ones – would be able to capture an increasing share of the available exports because of their greater average wealth. There are reasons, however, to believe that the conventional wisdom might be wrong.

Should we be concerned about declining oil exports? Jeffrey Brown, writing as westexas at The Oil Drum, regularly describes the Export Land Model. The ELM points out that historically, many – if not most – oil-exporting countries first satisfy domestic demand from their production and then export the surplus. Assuming that the exporting company has a growing economy, hence a growing demand for petroleum, when that country’s production begins to decline, its exports will decline at a higher rate. Indonesia provides an example that matches the model very well, as shown in the graphic history of their oil production, consumption, and exports below. Consumption continued to grow with the economy, and while production did not peak until about 1995, exports began declining in 1992 and fell at a faster rate than production was falling.


The consequences of this behavior by oil-exporting countries (or former oil-exporting countries; Indonesia has withdrawn its active membership in OPEC) suggest that global oil exports will begin to decline before global oil production peaks. Some EIA data suggests that oil exports have already peaked. How much oil will be available for importing is a very pertinent question, as is the question of who will capture how much of those exports.

More recently, the ELM 2.0 model was introduced. That model notes that during the global recession beginning in 2008, oil consumption in developed countries (the US in particular) fell. Developing countries (China and India in particular) saw either a much smaller decline in consumption, or even continuing growth in consumption. The hypothesis is that the developing countries – or at least China and India – are able to outbid the developed countries for the available exports, and that this trend will continue. This outcome should not be surprising, and could have been anticipated based on “first principles” from economics.

One of the most important developments in economic theory in the late 19th century was the so-called “marginal revolution.” This concept asserted that economic decisions are not made on the basis of average costs or benefits, but on the basis of incremental ones. For example, a decision as to whether to purchase an additional barrel of oil is not made on the basis of the average use to which oil is put, but on the basis of the incremental use. As a general rule, the marginal value of a good diminishes with the amount of that good the consumer already has. A typical US consumer would put a great deal of value on the first few gallons of gasoline that they purchase because it is an input to high-value activities, such as getting to work. By the time that consumer purchases their millionth gallon, it has essentially no value; the consumer has already used all of the gasoline they can figure out a purpose for.

Based on their wealth relative to the price of oil, US consumers have historically used a lot of oil for relatively trivial activities. I have been known to point out that oil was cheap enough that many poor people in the US purchase additional gasoline rather than carefully monitor their tire pressures. Such is not the case in a developing country. There, the incremental barrel of oil is much more likely to be used to power an activity with much value than saving the time it takes to measure tire pressure. Since the marginal benefit from that extra barrel is greater in the developing country, that country can “afford” to pay a higher price for it. Ceteris paribus (Latin for “with other things the same”, and a favorite phrase of economists), in the face of higher prices for exported oil, the decrease in demand should occur in those importing countries that derive the lowest marginal value from the oil. Generally speaking, we would expect those to be the ones with a developed, rather than developing, economy.

There are some additional complicating factors. One of those is the cost of transporting oil from exporting to importing countries. One of the regions where oil exports are expected to continue growing is in the countries around the Caspian Sea. In 2009, Kazakhstan and China completed construction of a 2,228 kilometer-long pipeline running from the Caspian Sea to western China, where it connects to China’s internal pipeline network. A 1,056 kilometer-long spur connecting Russia’s Siberia-to-Pacific pipeline to China is scheduled to be completed by the end of 2010. Kazakhstan and Russia are two of the countries that still have growing oil exports. These pipelines make it much easier for those countries to transport oil that is produced from relatively isolated regions directly to China. In contrast, two of the major suppliers to the US that are relatively close – Mexico and Venezuela – are experiencing declining export rates.

This all suggests that the United States is likely to see its oil imports decline in coming years. The pool from which the US draws its imports will decrease. Rapidly developing countries like China will be able to outbid the US for that oil at the margin. Transportation considerations will make it easier for some of the countries that still have rising exports to deliver oil to China than to the United States.

Monday, June 14, 2010

Energy and... Pensions?

John Eatwell properly describes pensions [1] as arrangements for transferring a portion of the goods and services produced by workers to non-workers (the elderly and disabled). There are different systems for financing pensions, – that is for implementing the transfer – but those are secondary compared to the size of the transfer [2]. Many people have written that current pensions in the US are not sustainable for demographic reasons: the number of non-workers is growing at a higher rate than the number of workers. I want to argue that while pension systems in the US – and the world – may not be sustainable, demographics is not the reason. Or at least, it is not the primary reason.

Output by workers grows with increases in population and in productivity. Consumption by non-workers grows only with increases in their population. A little algebra shows that if the growth rate for productivity is equal to the difference in the growth rates in population, then the system remains in balance, even the the ratio of workers to non-workers is declining. Assuming equality in those rates, everyone's standard of living (per-capita amount of goods and services) remains exactly the same, as the increases due to productivity exactly offset the higher growth rate of the non-workers. If productivity growth is higher, then everyone's standard of living can increase. This has certainly been the case with the US Social Security system. The ratio of workers to retirees has fallen from about eight in 1956 to a little over three in 2009, but everyone's standard of living has improved.

Social Security critics contend that having the worker to retiree ratio decrease from three to two will be disastrous, even though the fall from eight to three was not. Either they are ignoring increases in worker productivity, or they are implicitly stating that productivity can't keep pace with the change in populations. The former is an error in analysis, as productivity has been the key factor to date. The latter is a point of legitimate concern, as I will discuss in just a moment. Before doing that, though, a small digression...

All of the formal models that show a Social Security “crisis” in 2040 or 2050 – the one used by the SS trustees, the one used by the Congressional Budget Office, the one used by the Cato Institute – show that the crisis is not the result of benefit growth relative to GDP, but because of revenue shortfalls relative to GDP. The shortfalls occur because the GDP growth due to increases in productivity largely go to workers earning more than the cap on wages subject to the SS tax. In short, the models forecast that the old saw that “a rising tide lifts all boats” will not be true, and that the tide is going to rise over at the end of the marina with the big yachts, but not at the end with the little rowboats. Such a trend is likely, IMO, to result in significant societal problems well before 2040. But that's a topic for another day...

Lots of people have put together some version of the graph shown here. This particular one plots, for a number of countries, the log of per-capita income on the vertical axis and the log of per-capita energy consumption on the horizontal. The size of the circle represents the population of the country. The line is a least-squares best fit to the data points, not weighted by population. The correlation between productivity and energy consumption is clear. The direction of the causal arrow is unclear; do countries use more energy because they are richer (eg, jet skis for leisure), or are they richer because they use more energy (eg, backhoes instead of shovels)?


From its beginnings with Solow, economic growth theory has struggled to account for the growth that has actually occurred in the developed countries. Solow found that about 65% of the actual growth had to be attributed to factors other than labor and capital. Lots of different additions to the basic theory have been suggested, such as the concept of “human capital,” resulting in increasingly complex models. Ayres and Warr have taken a different approach [3], and assumed that the underlying problem was the model of production. A production function with a term for external energy sources fits the actual history in both the US and the UK quite well. Their work provides a theoretical basis for a causal link from energy use to productivity.

Which brings us back to the subject of pensions. The sustainability of our pension systems requires that productivity increase sufficiently to offset the difference in the growth rates of worker and non-worker populations. Productivity increases require increased energy consumption (less increases in energy efficiency). Can energy use increase at the required pace, for say the next 30 years? The opinions on that question are all over the map. To select a few: James Kunstler says not just no, but hell no; Amory Lovins says probably yes, because efficiency can be improved so much; and the Energy Information Agency just says yes. I am inclined to say “Yes, in the long run,” but there's going to be an ugly transition period.

  1. John Eatwell, “The Anatomy of the Pensions 'Crisis'”.
  2. In Eatwell's model, “public” and “private” pensions are fundamentally the same except for the financial mechanism for making the transfer. In a public pension, such as the US Social Security program, the transfer is implemented in the form of taxes on workers and government payments to non-workers. In a private system, the transfer is implemented in the form of sales of assets (primarily financial instruments such as stocks and bonds) by non-workers to workers. Both mechanisms have advantages and disadvantages, but in both it is clear that non-workers receive their pension only through the cooperation of the workers. If the workers don't pay their taxes in a public system, the non-workers have a problem. If the workers don't buy the securities from the non-workers in a private system, the non-workers have exactly the same problem.
  3. Robert U. Ayres and Benjamin Warr, “Accounting for Growth: The Role of Physical Work”.

Wednesday, June 2, 2010

Initial Thoughts

Everyone ought to have a blog, I suppose. Someplace where they can write down random thoughts to be inflicted on the rest of the world. This is mine. The thoughts I will bother to write down will tend to be in the area of public policy, with an emphasis on energy policy. Not that that will stop me from writing about other things from time to time. My concerns with energy tend towards the macro rather than the micro, but again, that won't be a hard and fast rule. If I were to sum my concerns up in a sentence, it would probably be “I want my kids and grandkids to have lights; modest but comfortable living space; running water and sewers; adequate food; modern medicine; and computers.”

Using Peak Oil vernacular, I am not a cornucopian. At 6.7 billion people, the planet is almost certainly overcrowded, and possibly horribly so, particularly if you think about that many people living something that approximates the lifestyle I want for my own descendants. Business-as-usual is almost certainly not a workable option. The amounts of energy, and the sources of that energy, that my descendants use will be different than what I use. However, I admit to a certain – some might say considerable – degree of parochialism: the degree of overcrowding and the availability of energy resources varies from region to region, and I am more concerned about my own kids than about the kids of people living on the other side of the world.

On the other hand, I am not a Jay-Hanson dieoff.org doomer either. For one thing, overpopulation is not a uniform phenomenon. China and India together have an estimated 2.52 billion people in 4.97 million square miles; the United States and Canada have 0.34 billion people in 7.65 million square miles (507 people per square mile versus 44, more than an order of magnitude difference). Even within the United States, the distributions are not uniform. The portion of the contiguous 48 states west of the 100th meridian has the lion's share of the country's high-quality renewable energy resources (wind, solar, geothermal, undeveloped hydro) but only about one-third of the population.

Perhaps more importantly, the doomer view does not lend itself to the formulation of public policies that have any chance of being adopted. The message that we need to aim for Kunstler's World Made by Hand so that we don't crash even farther may be true, but it's not one that can be sold. It may not be possible to end up with a regional scaled-back energy-efficient version of modern technology (I won't say lifestyle), but I refuse to adopt that as a starting point for setting policy. To be fair, I will note that the cornucopian view has the opposite problem: if today's lifestyle and energy consumption can continue indefinitely, then there's little need to think about new policies at all.

Some caveats are probably in order. I like numbers. I like formal models. When the discussion involves engineering or economics, I like those to be done on a sound basis. When I make assumptions, I try to know when I am doing so and point them out. However, assumptions are just that and should be examined from time to time in the light of new knowledge. Let's see how it goes.